Here’s a little introductory tutorial to Microsoft Azure’s Machine Learning Studio. One of its many great features includes the incredibly simplistic drag-and-drop based UI, which basically means that you don’t even need to know how to code to make use of the excitement that machine learning has to offer 🙂
We’ll answer this question: How can I predict if a given person will earn an annual income of over $50k?
First off, let’s start off by visiting Azure’s Machine Learning Studio at https://studio.azureml.net/. Once you’re in the studio, create a new blank experiment. This is what you should see:
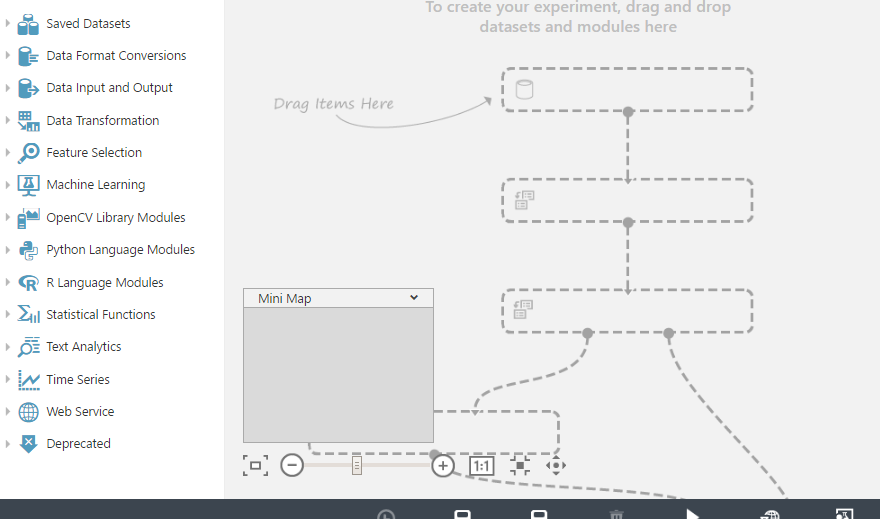
On the left panel are a bunch of components you can choose from. You’ll need some data. This can either be imported as a CSV file, for instance, or can be manually entered, but if you don’t have any data on hand, you can simply use sample data that is already provided (Saved Datasets -> Samples). Pick the first one: ‘Adult Consensus Income…’. Drag and drop it onto the grey menu. I suggest you visualize this data so you have an idea of what you’re working with. You can do so by clicking on the circle below the tab you just dropped. Here’s what you should see:

If you scroll all the way to the right of the data, you’ll notice that this is a binary dataset–which is exactly what we want when trying to answer a True/False question like ours.

Next, you want to select the columns of interest (Data Transformation -> Manipulation -> Select Columns in Dataset). This will essentially filter out the unnecessary data that could introduce error in your results.

Again, drag and drop the ‘Select Columns’ tab and connect them via the little circles. Click on the ‘Select Columns’ tab and on the right you will be able to launch a column selector. Pick the columns according to criteria you’d like to base your predictions on. A few good ones would probably be age, education, and sex. You would, however, need the income field whether you like it or not!
The next step is where the machine learning comes into play. Don’t worry, though. It’s still just a simple drag-n-drop. Here’s where we pick the machine learning algorithm that we want to utilize to train our model. You’re free to implement your own algorithms and use those–Azure Machine Learning has great support for Python and R scripts. For the sake of this tutorial we’ll just be using a Two-Class Boosted Decision Tree (Machine Learning -> Classification -> Two-Class Boosted…). This is great for binary classification (i.e., answering your classic true/false questions). Link this to the ‘Train Model’ tab (Machine Learning -> Train -> Train Model).
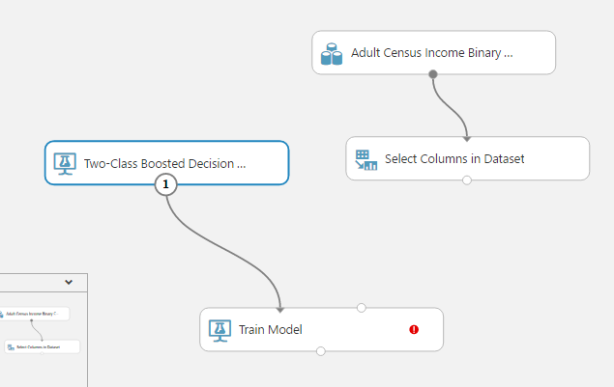
This is what you should have so far. Now you’ll notice that ‘Train Model’ needs another input, otherwise it gives you an error. This is because it not only because it needs an algorithm to be trained with, but also some data it can actually apply the algorithm to. We’ll only be using 80% of our data to train the model, and 20% to score it (this is to gauge how accurate the model is. More on that later). You probably don’t want to use a 50:50 ratio, because it’s better to have more data being used to train the model. To split the data: (Data Transformation -> Sample & Split -> Split Data).

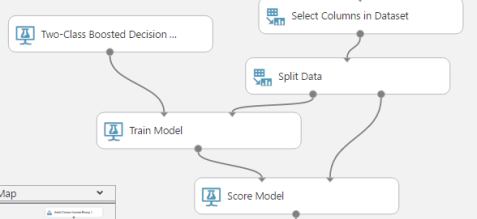
Make sure to select ‘Income’ when selecting a column for the output of ‘Train Model’. So, after splitting the data, that 80% portion of it goes into training the model, and the remaining 20% into scoring the model (Machine Learning -> Score -> Score Model). How does this work? The incomes of the remaining 20% was used as a test to see how well the trained model was able to correctly predict them, given what it had learned from the 80%.

Lastly, you want to evaluate your model (Machine Learning -> Evaluate -> Evaluate Model). This allows you to visualize how well your model did, and gives you a bunch of scores. Run your model (bottom panel), and then click on the circle on the ‘Evaluate Model’ tab and hit visualize. This is what you should see:

If you were to scroll down, you can see a score report on a bunch of statistics. (I like to take special note of the accuracy %). Hey, I’d say we did pretty good here! It’s a very good sign if your graph lies on the upper half of the diagonal. This means your model is making correct predictions a majority of the time.
And there you have it! You have just created a trained model that is able to predict if a given person will earn an annual income of over $50k. Now you can save this model for future use in another project, or you could even publish it as a web service.
Hope you enjoyed my first post! Please leave any comments or questions and I’d be happy to answer them 🙂

Good job! Great help! 🙂
LikeLiked by 1 person
Great tutorial! Love how simple it is to follow along 😀
LikeLike